What this guide covers
Microsoft Forms is included with every Microsoft 365 license and lets you build surveys, polls, quizzes, and registration forms in minutes -- no special training required. Responses are collected in real time, viewable as charts in Forms, and exportable directly to Excel for deeper analysis. This guide walks through every step from creating your first form through advanced features like conditional question routing, theme customization, and results analysis.
Each section is a self-contained walkthrough you can follow in order or jump to as a reference. All steps reflect the current Microsoft Forms experience in Microsoft 365.
Free Training Videos
One free YouTube video for each of the 9 guide sections. Click any card to watch.





Create a Form
Start a new survey, poll, or quiz from scratch or from a template
Get to Microsoft Forms
- Go to forms.microsoft.com and sign in with your Microsoft 365 account, or open Forms from the M365 app launcher (the waffle icon) in any Microsoft 365 app.
- Click + New Form to start from a blank form, or choose New Quiz if you want scored responses. You can also browse Templates for pre-built options like satisfaction surveys and event registrations.
- Click the form title at the top (Untitled form) and type a descriptive name. This is what respondents will see at the top of the form.
- Optionally add a description below the title to explain the purpose of the survey or give instructions to respondents.
Add your first question
- Click + Add new to insert a question. A menu appears showing all available question types -- Choice, Text, Rating, Date, and more.
- Select Choice for your first question (most common for surveys). Type your question text, then add answer options by clicking + Add option.
- Toggle Required on any question to make it mandatory before the form can be submitted.
- Click the ... (more options) menu on any question for additional settings like shuffling answers or allowing multiple selections.
The Forms Interface
Navigate the editing experience and understand where everything lives
Key areas of the editor
- Questions tab -- Where you build and edit all your questions. This is the default view when you open a form.
- Responses tab -- Shows incoming responses in real time as a summary with charts, plus a list of individual submissions.
- Preview button (eye icon, top right) -- Shows exactly what respondents will see. Always preview before sharing.
- Share button (top right) -- Opens sharing options including link, QR code, email, and embed code.
- Style button (palette icon) -- Apply themes, colors, and background images.
- ... (More options) -- Settings, form language, branching, and collaborator access.
Settings worth knowing
- Click ... > Settings to control who can respond (anyone, or only people in your organization), whether responses are anonymous, and whether respondents can see results after submitting.
- Set a start and end date if you want the form to automatically open and close at specific times -- great for timed surveys or event registrations.
- Enable shuffle questions to randomize question order for each respondent -- useful for reducing bias in surveys.
- Enable one response per person (requires sign-in) to prevent duplicate submissions.
Question Types
Choose the right question type for what you're trying to learn
Core question types
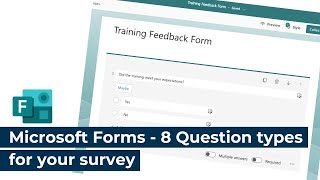
- Choice -- Multiple choice. Toggle "Multiple answers" to let people pick more than one. Add an "Other" option so respondents can write in their own answer.
- Text -- Open-ended text response. Toggle "Long answer" for paragraph-length responses. Good for comments, feedback, and explanations.
- Rating -- Star or number scale. Choose 2-10 stars. Add labels for the low and high ends (e.g., "Not satisfied" to "Very satisfied").
- Date -- Respondents pick a date from a calendar. Useful for scheduling or tracking.
Additional question types
- Ranking -- Respondents drag options into their preferred order. Great for prioritization surveys.
- Likert scale -- A grid of statements all measured on the same scale (e.g., Strongly Agree / Agree / Neutral / Disagree / Strongly Disagree). Useful when you have several related things to rate in one compact table.
- File upload -- Respondents can attach a file. Files are saved to your OneDrive. Only available when sign-in is required.
- Net Promoter Score (NPS) -- A 0-10 scale asking how likely someone is to recommend something. Industry standard for satisfaction measurement.
Rating, Ranking & Scale Grid Questions
Capture nuanced opinions and priorities with specialized question formats
Rating questions
- Click + Add new and select Rating. Choose between Stars (visual) or Numbers (1-10 scale).
- Set the scale level (2-10). A 5-star scale is the most intuitive for general satisfaction. A 10-point scale gives more granularity for NPS-style questions.
- Add low and high labels to anchor the scale -- e.g., "Not helpful" on the left, "Extremely helpful" on the right. Always label both ends to avoid confusion.
Scale grid questions (Likert)
- Select Likert from the question type menu. This creates a table where each row is a statement and the columns are shared labels like "Strongly Agree" to "Strongly Disagree." Respondents click one option per row.
- Use this format when you have 3 or more related things to measure on the same scale -- it keeps the form compact instead of adding a separate question for each statement.
Ranking questions
- Select Ranking. Add the items you want respondents to rank (e.g., project priorities, feature preferences).
- Respondents drag and drop items into their preferred order. The results show average rank position for each item.
- Keep ranking lists to 5-7 items maximum -- longer lists become tedious and reduce response quality.
Conditional Question Routing
Show or skip questions based on how someone answers -- so respondents only see what's relevant to them
How conditional routing works
Conditional routing (also called skip logic or branching) lets you route respondents to different questions based on their answers. For example: if someone rates satisfaction as 1-2, show a follow-up "What went wrong?" question. If they rate 4-5, skip straight to "What did we do well?" This way each person only sees questions that are relevant to their situation -- not every question in the form.
Set up conditional routing
- Click ... > Branching from the top menu. This opens the routing editor, which shows each question and its answer options with dropdown menus for where to send the respondent next.
- For each answer option, use the dropdown to choose which question to jump to next -- or select End of form to end the survey after that answer.
- Leave an option blank to continue to the next question in normal order.
Tips for conditional routing
- Build all questions first, then set up branching. It's much easier to route between questions when they all already exist.
- Routing only works on Choice questions (single answer). You cannot conditionally route off Text, Rating, or Ranking questions.
- Always use Preview to test every branch path before sharing. Walk through each answer option yourself to confirm the routing is correct.
- Avoid branching on the last question -- there's nowhere to route to. Put branching questions in the middle of your form.
Sections
Group related questions into pages so your form doesn't feel like a wall of questions
Add a section
- Click + Add new and select Section from the question type options. A new section header is inserted as a page break.
- Give the section a title and optional description. Respondents see the section title at the top of each page as they move through the form.
- Drag questions into the correct section. Questions below a section header belong to that section until the next section header.
- Respondents click Next to move between sections and can use Back to review previous answers before submitting.
When to use sections
- Forms with more than 8-10 questions -- breaking into pages reduces overwhelm
- When questions fall into distinct topic groups (e.g., "About You" then "Project Feedback" then "Next Steps")
- When combined with branching -- you can route entire sections based on an early answer
Theme & Appearance
Customize colors, fonts, and background to match your brand or event
Apply a theme
- Click the Style button (palette icon, top right of the editor). A panel opens on the right showing pre-built themes.
- Browse the pre-built themes and click one to apply it instantly. The form preview updates in real time.
- Click Customize to choose your own background color or upload a background image. You can also change the font style from here.
- Use the AI theme generator (if available in your tenant) -- type a description and Forms suggests a matching color palette and background.
Best practices
- Keep themes light and neutral for professional surveys -- busy backgrounds reduce readability
- If your organization has brand colors, use Custom theme and enter your brand hex code for the background
- Always Preview after applying a theme to check that question text is readable against the background
- Avoid using a dark background image with dark text -- Forms doesn't always auto-adjust text color
Results & Export
View responses in real time, analyze charts, and export data to Excel for deeper analysis
View responses in Forms
- Click the Responses tab at the top of your form. The summary view shows response counts, completion rates, and charts for each question.
- Click View results to see individual submissions one at a time, or scroll through the summary charts to see aggregate patterns.
- Use the Post button to share a summary of results with respondents if you enabled that option in Settings.
Export to Excel
- On the Responses tab, click Open in Excel. This downloads an .xlsx file with one row per response and one column per question.
- The Excel file stays live-linked -- click Data > Refresh All in Excel to pull in new responses without re-downloading.
Working with exported data
- Choice questions export as text labels -- use Excel's COUNTIF to tally how many people selected each option
- Rating questions export as numbers -- use AVERAGE to calculate mean scores
- Ranking questions export as a semicolon-separated list of items in ranked order -- requires extra parsing
- Text responses export as raw text -- read through manually or use pivot tables to spot patterns